Making Sense of a Market in Chaos – by VAR Capital
Summary
Equity markets remain under pressure in April after a difficult March, with US stocks as proxied by the S&P -6.9% on the month and -11% on the year. Equities outside of the US, while generally performing a bit better, have not been immune. Looking at the sector picture, some of the worst performers have been economically sensitive sectors such as banks and semiconductors, while consumer durables have also been under pressure, probably due to their reliance on global supply chains where tariffs may weigh on profitability.
The driver of the selloff has been a draconian set of tariffs announced by the Trump administration this week. The levels of the tariffs and their implementation appears to have been poorly thought out, generating unprecedented levels of economic policy uncertainty, and also driving an equally overblown response from trade partners such as China, who have briefly responded with their own tariffs, which have stoked fears of a full-blown trade war.
While there has been much focus on the equity selloff, of equal concern has been the move in currencies, notably the trade-weighted dollar, which could have far-reaching consequences (potentially including stagflation, though that’s not our base case scenario) for global markets.
VAR were relatively conservatively positioned going into the selloff, having generated cash earlier in the year through selling some winning investments. We’ve further reduced some relative winners as markets have sold off, and have ample cash to deploy into interesting opportunities when opportunities present themselves to us. On the fixed income side, we’re very conservatively positioned, only holding government bonds and investment grade corporate bonds, which have performed well over the equity market selloff and mitigated some of the drawdown we’ve seen in equities. We’re slightly overweight US equities, but see opportunities in many markets.
While it’s tempting for investors to sell when markets are weak and wait until the picture becomes clearer, Warren Buffett said it best when he quipped that “you pay a very high price in the stock market for a cheery consensus”. By the time the seas are calmer, equities are normally meaningful higher. We see many interesting emerging opportunities, and would advise staying invested.
Detailed Commentary
Following a difficult March for equities, the selloff in risk assets has gathered momentum in April, with stocks continuing to fall. At the time of writing, the MSCI ACWI has declined another 5% for the month. The weakness has been most evident in US stocks, with the S&P -6.9% on the month at the time of writing, following yesterday’s bruising 4.8% decline and more losses on Friday morning – YTD losses on the S&P now stand at 11%, while the peak to trough decline is about 15%. MTD losses on both the Nasdaq and the Russell 2000 index of midcap stocks registered worse performance, declining 8.1% and 8.4%, respectively. European equities, while still outperforming YTD, have also sold off in sympathy with US stocks, with the Stoxx 600 registering a 6.7% (in EUR) decline on the month. Asian equities and EM equities, while not immune from the selloff, have held up relatively better.
Briefly examining the sector picture, the worst performers over the last five trading days have been consumer durables (we think this is probably supply chain related – many of these companies are heavily reliant on China/Vietnam/Thailand for production, which could be a headwind going forward – more on this below), banks (we think due to 1) markets attempting to price in recession risk; 2) they’ve been relative outperformers YTD and there’s probably some element of hedge funds selling winners into book de-grossing which is doubtless happening at the moment), and finally tech/semiconductors (again a sector whose relative underperformance is a classic example of markets trying to price in recession risks).
Looking at what has driven the selloff in stocks, the “Liberation Day” tariff announcements earlier this week are clearly front and centre of the market volatility. The context behind this is that President Trump appears to hold a deeply seated belief that foreign nations “cheat” on international trade. He’s not been shy about voicing this opinion in recent months, but this appears to be a conviction that he’s held since at least the 1980’s (https://www.youtube.com/watch?v=6BJYbn4MppM) – back then, Japan and Kuwait the protagonists called out, whereas today the cast of villains in his mind appears to include China and Vietnam, among others. Leaving aside for a moment any judgement on the veracity of this view, the fact of the matter is that President Trump seems intent on righting this perceived wrong, and announced sweeping tariffs in what was a “shock & awe” moment for markets, with tariffs for the main offenders (in the eyes of the Trump Administration) in excess of 30% (far higher in some cases). On Friday morning, China responded to this by announcing 34% duties on all US goods, which drove another leg lower in markets.
In terms of how the numbers were arrived at, it appears that the metric may have been to take on a country-by-country basis, the trade deficit, divide that by the level of imports, and then divide that number by two. In a simple example (not actual numbers), if the US exported $10bn of goods and services to Vietnam (the country that is subject to the most draconian tariff), while importing $100bn of goods and services from Vietnam, then its trade deficit would be $90bn; given imports of $100bn, the tariff level would be (($100bn – $10bn) / $100bn) / 2 = 45%. Running this analysis on actual trade numbers and comparing it to the actual tariffs proposed, we see a very high correlation between tariffs predicted by this model and what’s been announced:
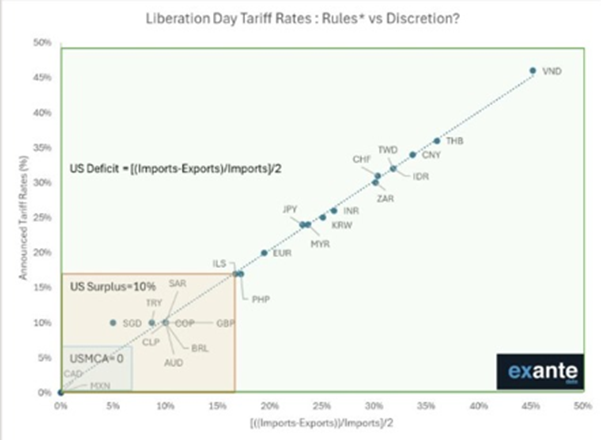
Source: moneyinsideout.substack.com
VAR are probably not alone (judging by the market reaction) in being a little perplexed by the theoretical underpinnings of this approach. Take the stylised example that we gave above – in the absence of a scenario where Vietnamese exports (along with US consumption) simply disappear, by definition the only way to balance this deficit would be for Vietnamese consumers to consume an additional $90bn of US goods and services – it’s not obvious to us that there are enough wealthy Vietnamese consumers to purchase $1,200 iPhones and $100k SUV’s to balance this deficit without a deadweight loss (which probably goes some way to explaining the 6.7% loss (in local currency) in Vietnamese equities on the day of the announcement).
Referencing our “shock and awe” reference above, the capricious and arbitrary nature of US trade policy has generated considerable uncertainty in markets. To put some reference around that, we include below an index computed by Baker, Bloom and Davis (https://www.policyuncertainty.com/index.html), an economic policy consulting firm, which measures, among other things, the level of economic policy uncertainty in the US, rebased to 100 as a “normal” level. In the run-up to the first round of tariffs in 2018, the index spike to ~900 (before eventually peaking at ~2,000); during the Gulf War, the index got to around 1,000; as of the end of March (i.e. before the “Liberation Day” announcements), the index stood at ~5,700:
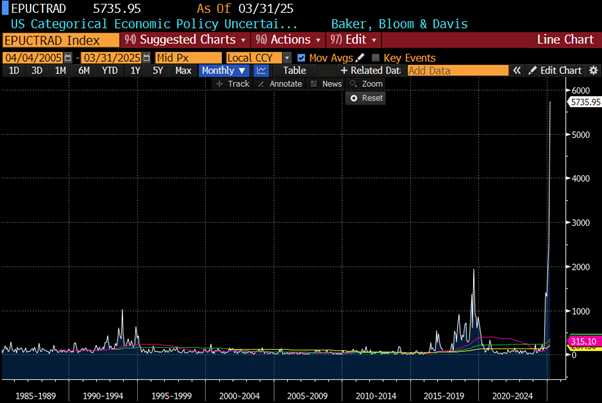
US Economic Policy Uncertainty Index; source: Baker, Bloom & Davis, Bloomberg
Markets do not like uncertainty – currently there is a lot of it.
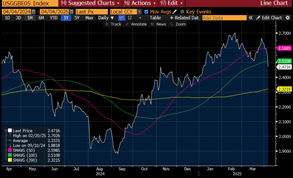
As stated above, our theoretical quibbles about the approach taken are essentially irrelevant – the fact of the matter is that this policy, however boneheaded, appears to be a reality that markets are now attempting to price in. The popular objection to tariffs that we often see rolled out in the financial community is that they tend to be inflationary, which is usually not a good thing. That may not necessarily be the case, and indeed the Trump administration may well point to the experience of the first round of tariffs during his first term in office, in which CPI remained muted as dollar strength vs RMB offset the tariffs placed on China. From an Economics 101 standpoint, this is what the textbooks tell us should happen, all other things being equal, when tariffs are imposed – and indeed this was what happened. One can argue that there were other cross currents driving USD strength at the time (notably the Fed was in a rate hiking cycle), but the key takeaway was the President Trump was able to claim a win on trade policy and that things played out as he predicted. One critical difference this time around is that the dollar is moving in the opposite direction in 2025 relative to 2018, with the dollar falling around 7.2% on a trade-weighted basis from the January highs:
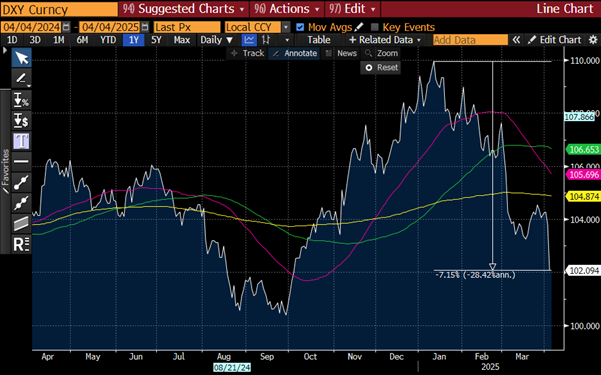
DXY (USD on a trade-weighted basis); source: Bloomberg
The dollar move is, for many investors, equally if not more concerning than the move in equities. One interpretation is that the move represents some kind of vote of confidence (or lack of confidence) in the US leadership, with the ultimate risk there being a loss of reserve currency status (our view there is that we’re still far away from that scenario materialising, due to a lack of viable alternatives). While this is more of an existential risk, the more immediate consideration is, to our mind, what this means for inflation. In a scenario where tariffs are imposed and there is no offsetting currency appreciation to cushion the blow for consumers, one would expect that to be quite inflationary. Interestingly, that does not appear to be (at least to us) what bond markets are pricing in. Below we include snapshots of “breakeven” inflation rates (essentially the difference in price between bonds with and without inflation protection, with the difference being an implicit judgement by markets on the level of inflation).
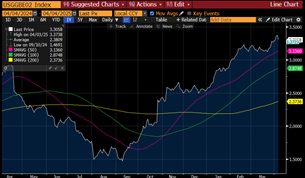
Market-Implied 2y (left side) and 5y (right side) inflation expectations; source: Bloomberg
What stands out to us is that while there’s been a slight upward revision in expectations over the next two years, on a five year view expectations have done nothing (in fact they have reversed a little). There are a few different potential reasons for that to ponder.
The most negative would be that the market simply expects a potential trade war to weaken growth and demand, which might lead to less inflation.
A second interesting conspiracy theory would be that the market could be telling us that there’s another way out of this for Trump. Given US corporate margins are at or near all-time highs, it might tempt the President to gather US CEO’s to the White House – one could easily imagine him telling them something along the lines of “Your profit margins are at all-time highs. You are not to raise prices. We are fighting a trade war with China and I want your loyalty. You need to keep prices flat and wear the additional costs in your P&L. If you don’t play ball, you can expect me to be calling you out by name as a traitor on Truth Social and on Fox News”. That would be quite a negative outcome for US earnings and, while not our base case assumption, is a scenario we’re discussing.
A final, more cheerful interpretation would be that the reason for the disparity between the higher two year inflation expectation and the lower five year inflation rate is that the market believes that the tariffs will have a relatively short half-life and essentially won’t survive beyond the US midterm elections.
What We’ve Been Doing/How We’re Positioned
Our equity portfolio was fairly conservatively positioned coming into the selloff that began in late February. We began reducing our expsore in late January, selling out of a couple of equity positions that had done well where we felt the upside had played out (Hasbro and Astrazeneca), while also trimming positions in Nestle and S&P Global – two positions that we felt still had some upside, but certainly less upside given their strong performance. Over the course of March, we finished selling the remaineder of our holding in Nestle. In the early days of April, we sold out of a couple of other holdings (the remainder of our S&P Global position, and all of our position in Zoetis, two companies that, while still excellent companies in our view, trade on quite demanding multiples and have already relatively outperformed this year by quite a margin. We added one new investment to the portfolio – Ryanair, the European low cost airline. While the company is obviously not immune from a recession, we like the company’s low cost producer position, are impressed by their long-term returns on capital, and believe that the shares trade on an attractive multiple of medium-term earnings.
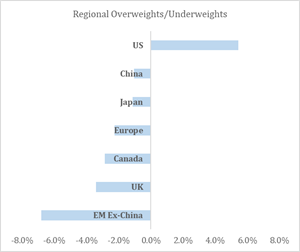
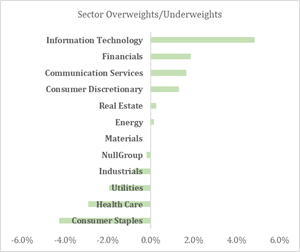
Looking at our positioning, we are currently sitting on a roughly 10% cash position, which we feel is prudent given market volatility, and should give us the flexibility to deploy capital into compelling risk/reward situations as and when the opportunities present themselves. In terms of regions and sectors where we’re overweight/underweight, we include a full summary below, but the brief summary is that we remain modestly overweight US equities relative to the rest of the world, while our biggest overweight by sector continues to be IT. While US stocks have clearly borne the brunt of the selling YTD and in have continued to see selling in recent days, we continue to believe that the opportunity set in the US is far from extinguished by the Trump administration’s latest adventures into international trade, and one must simply be patient and selective.
While the current picture looks bleak and confusing, in the words of Warren Buffett, “you pay a high price for a cheerful consensus”. In terms of our advice to investors following current developments and contemplating selling out and returning when the situation is less volatile, we would caution against such an approach. While it’s tough to stay fully invested, equity returns over time can be best thought of as a risk premium one harvests for assuming equity market risk. Yes, it would be great to avoid the drawdowns, however the investment landscape is unfortunately littered with the bodies of market timers – market timing is difficult. To underscore the importance of remaining fully invested, we present two time series below – the dark blue one is the value today of a notional $100 invested in the S&P index in 1995; the light blue line is the that same value excluding the returns on the best 20 days over that 30 year period:
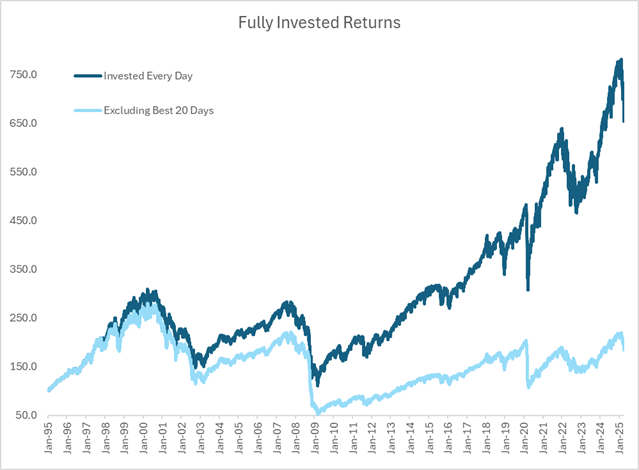
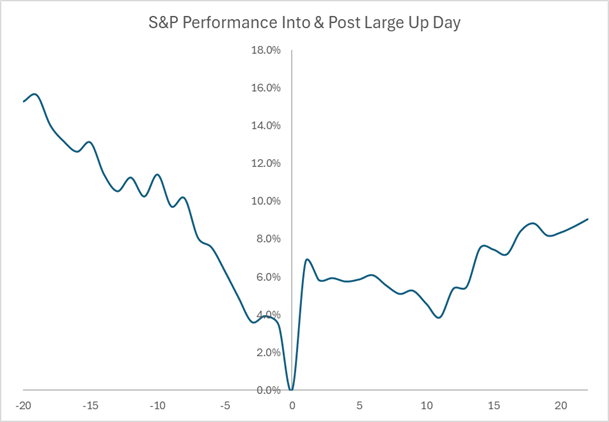
The chart below looks at the performance of the S&P into and after the large up day (with the up day being the 0 on the horizontal consensus) – what one tends to see is that the up day tends to be preceded by steadily negative performance for a few weeks, with one “capitulation day” right before the rally. The risk of going into cash and waiting for more clarity is that one misses the large up move – as the former chart shows, this can do serious damage to one’s long-term returns.
Disclaimer:
This message is provided for information purposes and should not be construed as a solicitation or offer to buy or sell any securities or related financial instruments, nor does the information constitute advice or an expression of our view as to whether a particular financial product is appropriate for you. Please note that we do not provide any tax or legal advice and clients must seek their own tax advice independently.
VAR Capital is an independent financial services firm offering asset management, lending and family office services. It was founded by individuals with extensive experience from Banking, Asset Management and Family Offices. Based in Mayfair, London, VAR Capital Ltd is authorised and regulated by the Financial Conduct Authority (FCA).
Source: VAR Capital
Media Contact: Vikash Gupta, vikash@varcapital.co.uk